

Market Report · September 2026
Amberlea, Pickering Real Estate Market Report, September 2026
A west Pickering community known for its schools and mature detached homes on quiet, family streets.
Median sold price, September 2026
$835,000
↓ 17.3% YoY
Avg days on market
31 days
How fast homes sell
Homes sold, September 2026
11
112 in the 12 months to September 2026
The median home sold for $835,000 in Amberlea, Pickering (11 sales, September 2026), down 17.3 percent year over year, selling in an average of 31 days. This Hinchey Homes Real Estate Team market report tracks Amberlea, Pickering sold prices, days on market, and sales volume using Toronto Regional Real Estate Board (TRREB) MLS data.

Shawn Hinchey
Broker, Hinchey Homes Real Estate Team
RECO registered, TRESA compliant, serving Durham Region since 2013
Published: June 4, 2026 · Last updated: September 30, 2026
Where this data comes from: aggregate Toronto Regional Real Estate Board (TRREB) MLS sold data. Data through September 2026, the most recent complete month with enough closed sales to report. Refreshed daily. Deemed reliable but not guaranteed.
What is the average home price in Amberlea, Pickering?
The median Amberlea, Pickering home sold for $835,000 (11 sales, September 2026), down 17.3 percent from a year earlier.
How long do homes take to sell in Amberlea, Pickering?
Amberlea, Pickering homes took an average of 31 days to sell in September 2026, measured from list date to sale date across closed transactions.
Are home prices going up or down in Amberlea, Pickering?
Amberlea, Pickering prices are down 17.3 percent year over year, and down 6.2 percent month over month. The market reads as balanced right now.
How many homes sell in Amberlea, Pickering each month?
11 homes sold in Amberlea, Pickering in September 2026, with 112 sold over the 12 months to September 2026.
What do homes sell for per square foot in Amberlea, Pickering?
Homes in Amberlea, Pickering sold for about $511 per square foot on average in September 2026.
Housing stock
What kind of homes are in Amberlea, Pickering?
Amberlea, Pickering's housing stock over the last 12 months of sales was 82 percent detached homes and 15 percent semi-detached, with detached homes selling for a median of $1,000,000. Overall prices sit about 7 percent below the Pickering median.
Sales by property type, last 12 months
- Detached82% of sales · median $1,000,000
- Semi-Detached15% of sales · median $848,500
- Att/Row/Townhouse2% of sales · median $780,000
- Link1% of sales · median $909,000
Where sold prices landed
- Under $600K0% of sales
- $600K to $800K4% of sales
- $800K to $1M56% of sales
- Over $1M41% of sales
Market behaviour
When do homes sell in Amberlea, Pickering?
Homes in Amberlea, Pickering recently took an average of 31 days to sell. Across roughly twenty years of sales, May has been the busiest month for closings and December the quietest, which matters when timing a listing.
Getting around
How is the commute from Amberlea, Pickering?
From central Amberlea, Pickering, Pickering GO is about a 3 minute drive (3.6 km), with Lakeshore East trains into Toronto's Union Station. The nearest 400-series access is Highway 401 at Brock Rd, roughly 8 minutes away by car.
Drive times are computed from the community centre in typical traffic and vary with conditions and your exact address.
Living in Amberlea, Pickering
What is it like to live in Amberlea, Pickering?
The housing stock is primarily detached homes, 82 percent of recent sales, alongside a meaningful semi-detached segment at 15 percent. Green space in and around the area includes Amberlea Park, Dunmoore Park, TreeHouse ClubHouse, Khel, among others.
Schools
Schools near Amberlea, Pickering
Amberlea, Pickering is served by the Durham District School Board and the Durham Catholic District School Board. Boundaries are set by the boards, they change, and the only authority on which school an address attends is the board's own locator. The schools named below sit in or near the community, and are not a catchment list. Schools in and around the area include Father Fenelon Catholic School.
- Father Fenelon Catholic School
School names come from map data. Confirm the catchment for any specific address with the board locators above. Boundaries and programs are determined solely by the boards.
Homes for sale
Homes for sale in Amberlea
 Listed on October 15, 2026
$999,000
1739 Ada Court
4 bed · 3 bath · MLS# E14082774
RE/MAX ROUGE RIVER REALTY LTD.
 Listed on October 15, 2026
$1,089,900
1520 Sturgeon Court
4 bed · 3 bath · MLS# E14034530
REALTY ONE GROUP REVEAL
 Listed on October 7, 2026
$1,049,900
664 Eramosa Crescent
3 bed · 3 bath · MLS# E13871048
SUTTON GROUP-HERITAGE REALTY INC.
 Listed on October 6, 2026
$899,999
1713 Kirkwood Lane
4 bed · 3 bath · MLS# E13867610
BAY STREET GROUP INC.
 Listed on October 6, 2026
$1,149,000
1794 Meadowview Avenue
4 bed · 3 bath · MLS# E13867214
ROYAL LEPAGE TERREQUITY REALTY
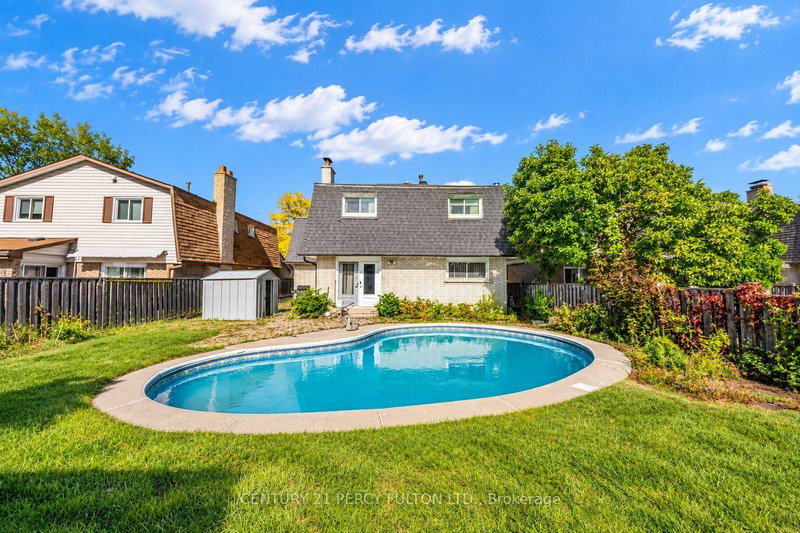 Listed on October 6, 2026
$850,000
705 Edgewood Road
4 bed · 3 bath · MLS# E13867112
CENTURY 21 PERCY FULTON LTD.
 Listed on October 1, 2026
$1,198,888
1859 New Street
2 bed · 4 bath · MLS# E13851622
RE/MAX CROSSROADS REALTY INC.
 Listed on October 1, 2026
$949,900
648 Cognac Crescent
4 bed · 4 bath · MLS# E13849260
RE/MAX ROUGE RIVER REALTY LTD.
 Listed on September 30, 2026
$1,095,000
1905 Wildflower Drive
3 bed · 4 bath · MLS# E13844170
HOMELIFE/CHAMPIONS REALTY INC.
Median sold price
Monthly median of closed residential sales
Data from TRREB MLS as of September 2026. Aggregate statistics only.
The listing data is provided under copyright by the Toronto Regional Real Estate Board (TRREB). The information is deemed reliable but is not guaranteed accurate by TRREB or Hinchey Homes Real Estate Team.
Sales volume
Homes sold per month
Data from TRREB MLS as of September 2026. Aggregate statistics only.
The listing data is provided under copyright by the Toronto Regional Real Estate Board (TRREB). The information is deemed reliable but is not guaranteed accurate by TRREB or Hinchey Homes Real Estate Team.
Average days on market
How fast homes are selling
Data from TRREB MLS as of September 2026. Aggregate statistics only.
The listing data is provided under copyright by the Toronto Regional Real Estate Board (TRREB). The information is deemed reliable but is not guaranteed accurate by TRREB or Hinchey Homes Real Estate Team.
Price per square foot
Average $/sqft of closed sales
Data from TRREB MLS as of September 2026. Aggregate statistics only.
The listing data is provided under copyright by the Toronto Regional Real Estate Board (TRREB). The information is deemed reliable but is not guaranteed accurate by TRREB or Hinchey Homes Real Estate Team.
Market temperature
Speed, competition, and momentum combined
Data from TRREB MLS as of September 2026. Aggregate statistics only.
The listing data is provided under copyright by the Toronto Regional Real Estate Board (TRREB). The information is deemed reliable but is not guaranteed accurate by TRREB or Hinchey Homes Real Estate Team.
Year over year appreciation
Annual change in median sold price
Data from TRREB MLS as of September 2026. Aggregate statistics only.
The listing data is provided under copyright by the Toronto Regional Real Estate Board (TRREB). The information is deemed reliable but is not guaranteed accurate by TRREB or Hinchey Homes Real Estate Team.
Seasonality
Average median sold price by calendar month
Data from TRREB MLS as of September 2026. Aggregate statistics only.
The listing data is provided under copyright by the Toronto Regional Real Estate Board (TRREB). The information is deemed reliable but is not guaranteed accurate by TRREB or Hinchey Homes Real Estate Team.
What is your Amberlea, Pickering home worth today?
Get a free, no obligation home valuation backed by the same MLS sold data behind this report. Shawn Hinchey personally reviews every estimate.
Get my free valuationSee recent sold prices in Amberlea, Pickering
Create a free account to unlock individual sold prices, price history, and comparable sales across Amberlea, Pickering. Verified consumers only, per TRREB rules.
See Amberlea, Pickering sold pricesStay ahead of the market
Get the Amberlea, Pickering market report in your inbox monthly
Median sold price, days on market, and where prices are heading, from the same TRREB MLS sold data behind this page. One email a month from Hinchey Homes Real Estate Team. Unsubscribe anytime.
Planning a move in Pickering?
Nearby markets
Amberlea, Pickering market report
Amberlea, Pickering real estate questions, answered
- The median Amberlea, Pickering home sold for $835,000 (11 sales, September 2026), down 17.3 percent from a year earlier.
- Amberlea, Pickering homes took an average of 31 days to sell in September 2026, measured from list date to sale date across closed transactions.
- Amberlea, Pickering prices are down 17.3 percent year over year, and down 6.2 percent month over month. The market reads as balanced right now.
- 11 homes sold in Amberlea, Pickering in September 2026, with 112 sold over the 12 months to September 2026.
- Homes in Amberlea, Pickering sold for about $511 per square foot on average in September 2026.
- These are aggregate statistics computed from Toronto Regional Real Estate Board (TRREB) MLS sold data and published by Hinchey Homes Real Estate Team. Headline figures come from the most recent complete month with enough closed sales to be meaningful, refreshed daily, never from the month still in progress. The figures are deemed reliable but not guaranteed. Individual sold listings, with addresses and prices, are available to registered, verified users only, per TRREB rules.
- Hinchey Homes Real Estate Team, brokered by eXp Realty, serves Amberlea, Pickering and the wider Durham Region. The team runs the Renos for Revenue pre-sale renovation program, where the median completed project has returned $1.95 in sale-price lift per renovation dollar (18 completed projects, analyzed July 2026), reports a 91.8% repeat-and-referral rate, and backs its listings with a Performance Guarantee. Start with a free home valuation to see what your home is worth today.
Hinchey Homes Real Estate Team, Shawn Hinchey, Broker, eXp Realty, Brokerage. Brokered by eXp Realty.
The listing data is provided under copyright by the Toronto Regional Real Estate Board (TRREB). The information is deemed reliable but is not guaranteed accurate by TRREB or Hinchey Homes Real Estate Team.
Statistics on this page are aggregate market figures computed from Toronto Regional Real Estate Board (TRREB) MLS sold data. Copyright © Toronto Regional Real Estate Board. Individual sold listings are available to registered, verified users only.
Not intended to solicit properties already listed for sale or buyers under contract.
Q3 2026 Market Recap
Amberlea
35 closed sales, July to September 2026.
$890,000
Median sold price, July to September 2026
-17.3%
Year over year, September 2026 vs the same month last year
35
Homes sold this quarter
25
Avg days on market
Homes in Amberlea sold for a median of $835,000 in September 2026, down 17.3 percent from a year earlier, in an average of 31 days on market. 11 homes changed hands over that period.
Hinchey Homes Real Estate Team, Shawn Hinchey, Broker, eXp Realty, Brokerage. Aggregate figures from TRREB MLS sold data. The listing data is provided under copyright by the Toronto Regional Real Estate Board (TRREB). The information is deemed reliable but is not guaranteed accurate by TRREB or Hinchey Homes Real Estate Team.